Tata Steel Share Price Declines 3% from Rs 160 Resistance; Major Support at Rs 146

Tata Steel shares witnessed a strong buying from yearly lows and the stock has offered almost 33 percent returns to investors from the lows. The steel major jumped from Rs 122 levels to hit a major resistance around Rs 160 and has witnessed a decline by 3 percent over the last five trading sessions. Tata Steel, SAIL and JSW Steel were in demand as international market steel prices are expected to remain strong in near future. Strong demand from China can keep steel prices elevated and this will help Indian steel manufacturers. TopNews Team has reviewed technical levels for Tata Steel for short term investors and traders.
As of the most recent trading session, the stock opened at Rs. 155.38, peaked at Rs. 156.91, and touched a low of Rs. 153.37. The company holds a market capitalization of Rs. 1.93 lakh crore with a P/E ratio of 70.21 and a dividend yield of 2.34%. The 52-week range is between Rs. 122.62 and Rs. 184.60.
Analyst Sentiment and Price Expectations
Tata Steel has received mixed-to-positive sentiment from analysts in recent quarters. While there has been some moderation in target prices, the consensus broadly leans toward a “Buy” or “Accumulate” stance.
Some analysts see moderate upside in the near term, with price targets ranging from Rs. 160 to Rs. 175. The positive outlook is based on expected improvements in domestic demand, export dynamics, and internal efficiencies within Tata Steel’s operations.
Technical Analysis: Candlestick Pattern Insights
On the daily chart, recent candlestick formations indicate a potential shift in momentum:
A Bullish Engulfing Pattern appeared near Rs. 153–154 levels, which typically signals a potential reversal and upward momentum when it follows a downtrend.
Prior sessions also showed Doji formations, suggesting indecision and indicating that traders should watch for a breakout direction in the following days.
The stock is testing a critical technical zone, and the next few sessions will be vital in confirming trend direction.
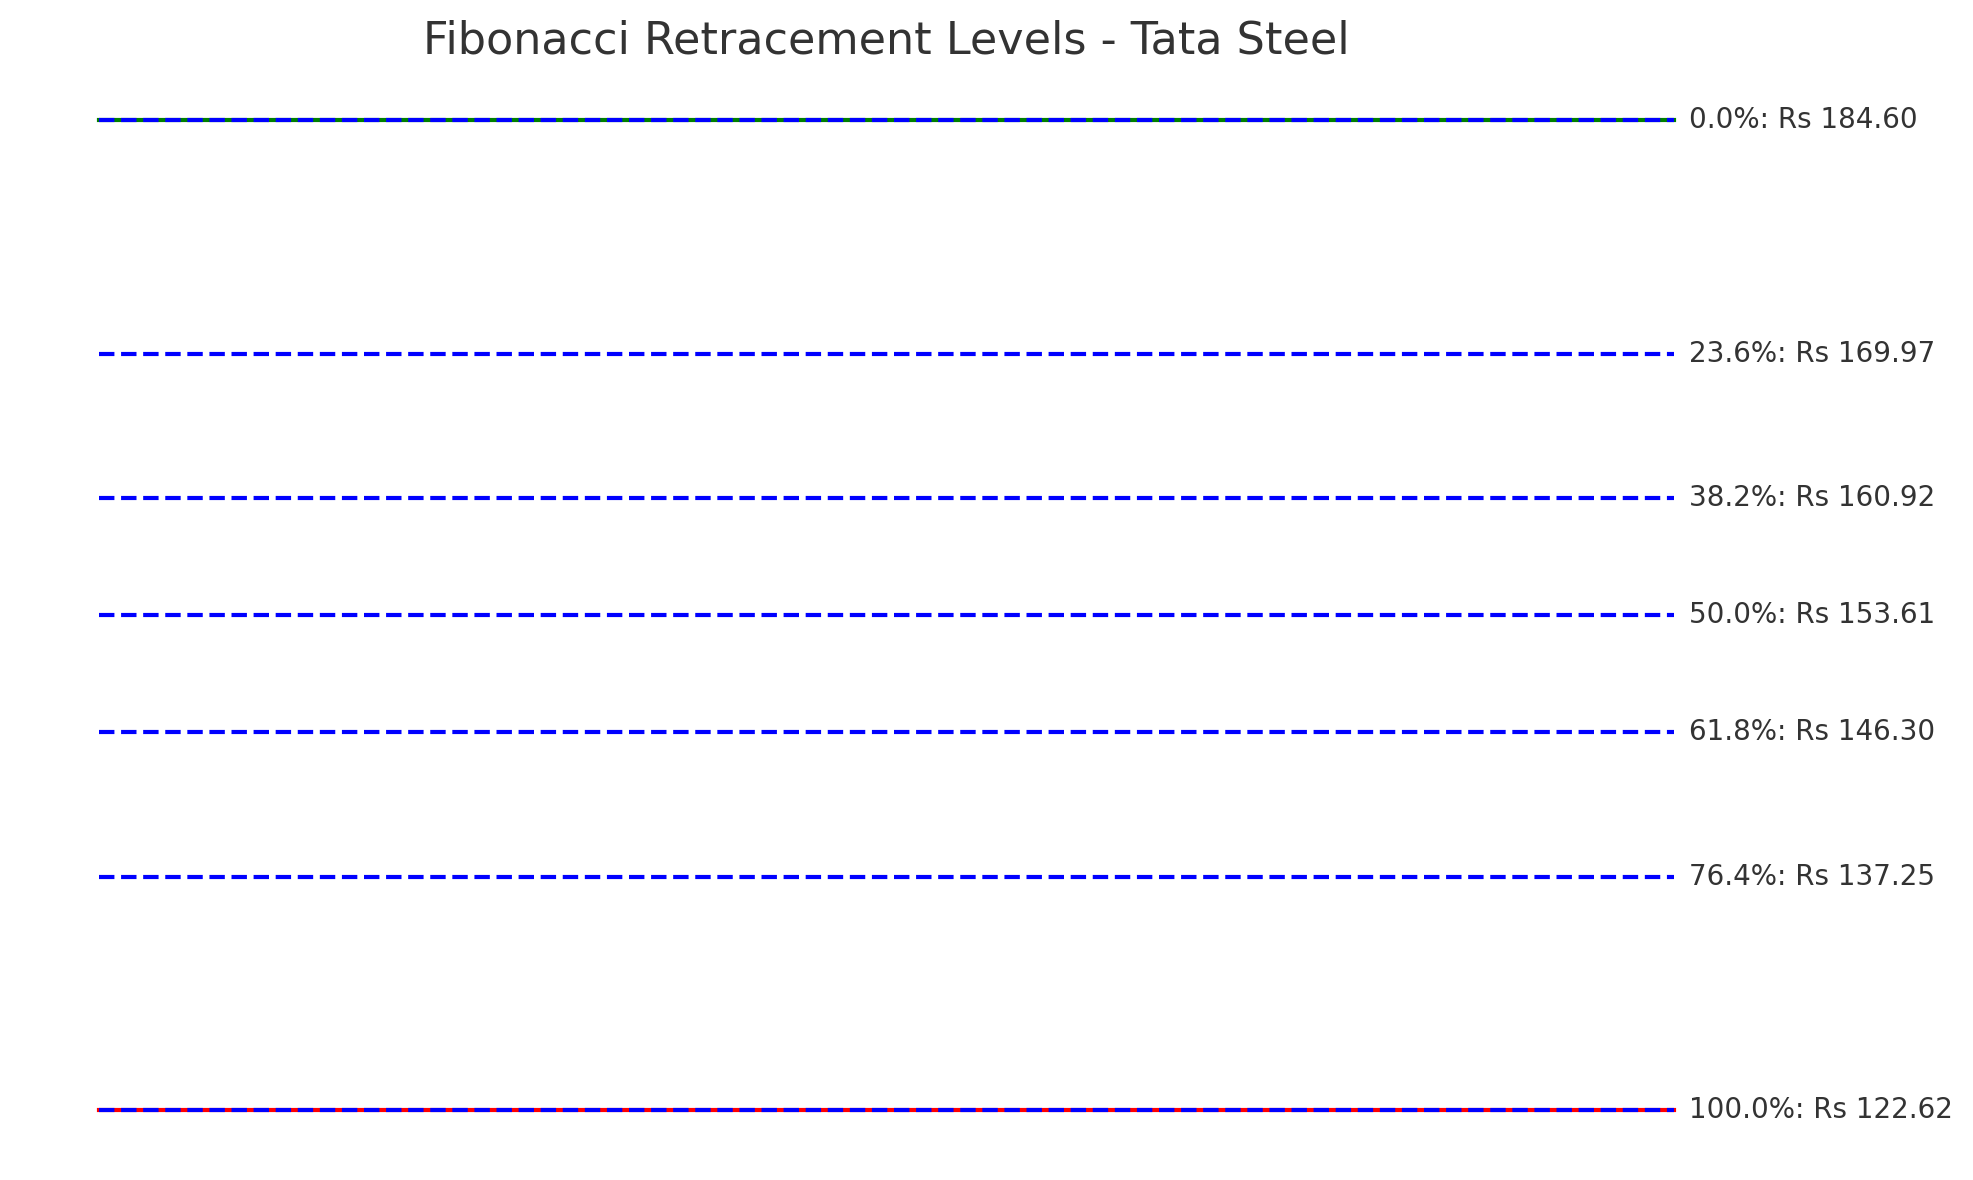
Fibonacci Retracement Levels
Using the 52-week high (Rs. 184.60) and low (Rs. 122.62), key Fibonacci levels have been calculated as follows:
| Fibonacci Level | Price (Rs) |
|---|---|
| 0.0% | 184.60 |
| 23.6% | 170.50 |
| 38.2% | 160.80 |
| 50.0% | 153.61 |
| 61.8% | 146.42 |
| 76.4% | 137.75 |
| 100.0% | 122.62 |
The stock currently trades around the 50% retracement level (Rs. 153.61), which acts as a significant technical support zone. A sustained move above this level could potentially lead to a rally toward Rs. 160.80.
Support and Resistance Zones
From a structural technical perspective, the following levels are important:
Immediate Support: Rs. 153.60
Next Support: Rs. 146.40
Resistance Zone 1: Rs. 160.80
Resistance Zone 2: Rs. 170.50
A breakout above Rs. 160.80 with volume confirmation could initiate a fresh bullish leg. Conversely, failure to sustain above Rs. 153.00 could trigger further consolidation or a mild correction.
Conclusion: Strategy and Outlook
Tata Steel’s current market positioning suggests it is approaching a pivotal price zone. With technical support aligning at the 50% Fibonacci level and recent bullish candlestick cues, the risk-reward ratio appears favorable for investors with a short- to medium-term horizon.
However, given the elevated P/E ratio of 70.21, investors should exercise caution and monitor macroeconomic factors, commodity cycles, and global demand dynamics closely.
For long-term investors, any price dips toward the Rs. 146–148 range may offer attractive accumulation opportunities, while short-term traders can watch Rs. 160.80 as a breakout trigger.
TopNews Hindi
- Karuppu, Parasakthi, Thaai Kizhavi, Blast and Kara Among Best Tamil Movies for 2026
- Anupama, YRKKH, Vasudha, Tum Se Tum Tak: सबसे ज़्यादा देखे जाने वाले धारावाहिक
- 2026 FIFA World Cup Current Rankings and Betting Odds for Sports Betting Fans
- JEE Main 2026: Exam Dates, Eligibility, Syllabus जेईई मेन 2026 परीक्षा की तारीखें, योग्यता, सिलेबस
- Geojit ने Apollo Hospitals पर BUY कॉल दोहराया, Share Price Target Rs. 9,587
