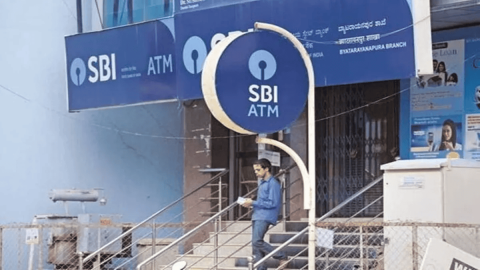
SBI Share Price Declines 3%; Capital Raising Plans Announced by SBI
SBI share price declined 3 percent in today's session. SBI opened at Rs 811.5 and that remained the day's high. The largest public sector bank closed at Rs 787.60 after touching intraday low at Rs 784.5. Market sentiment was neutral today and NSE Nifty ended the day flat after trading in a 200-point range. State Bank of India's asset quality is expected to remain stable over the next 12 to 18 months, with nonperforming and restructured loan ratios projected to stay between 2.5% and 3%, according to S&P Global Ratings. During the same period, credit costs are likely to remain below 1%, reflecting strong underwriting standards and prudent risk management. This outlook is underpinned by India’s robust economic growth, which continues to bolster the bank’s operational performance and lending environment. TopNews Team has reviewed technical levels for SBI stock for short term traders.
Fundamental Overview
The stock opened at Rs. 811.50, reached a high of the same value, and dipped to a low of Rs. 784.50 during the trading session. Its 52-week range of Rs. 680.00 to Rs. 912.00 highlights its moderate volatility, offering attractive swing opportunities. The stock's fundamentals — healthy dividend yield, attractive valuation, and substantial market capitalization — place it among the top banking equities on the Indian bourses.
Analyst Recommendations
Recent analyst outlooks have leaned bullish:
Target Price of Rs. 1,025 – reflecting a 30% potential upside from current levels.
Upgraded Target of Rs. 840 – demonstrating confidence in the bank’s strategic execution.
Conservative Target of Rs. 823 – implying limited downside risk and favorable long-term valuation.
These forecasts underscore market optimism around SBI’s future earnings potential and macro-resilient business model.
Technical Analysis
Candlestick Patterns
On the daily charts, SBI formed an Inverted Head and Shoulders pattern — a classic bullish signal. The breakout from the neckline near Rs. 787 was accompanied by rising volumes, affirming investor conviction. The breakout suggests continued momentum if the price sustains above short-term moving averages.
Fibonacci Retracement Levels
From the recent rally between Rs. 730.00 and Rs. 835.50, Fibonacci retracement points are:
| Fibonacci Level | Price |
|---|---|
| 23.6% | Rs. 810.60 |
| 38.2% | Rs. 795.20 |
| 50% | Rs. 782.75 |
| 61.8% | Rs. 770.30 |
The 50% retracement at Rs. 782.75 acts as a major support level, with investors watching this zone for possible accumulation.
Support and Resistance Levels
| Level Type | Price |
|---|---|
| Immediate Support | Rs. 778.60 |
| Major Support | Rs. 758.55 |
| Immediate Resistance | Rs. 827.10 |
| Major Resistance | Rs. 855.55 |
A breakout beyond Rs. 827.10 could lead to a rally toward Rs. 855+, while failure to hold Rs. 778.60 might invite short-term selling pressure.
Competitive Landscape
HDFC Bank remains a close peer, excelling in retail and digital banking with a history of consistent earnings growth and ROE. ICICI Bank follows closely, leveraging its retail and SME penetration alongside robust tech investments. SBI, however, stands out for its reach, government backing, and expanding loan book in both infrastructure and digital lending, making it a strong competitor with defensive appeal.
Investment Insights
Based on the convergence of technical patterns and supportive fundamentals, SBI is currently presenting a bullish short- to mid-term opportunity:
Short-Term Strategy: Watch for a breakout above Rs. 827. A move beyond that resistance may push the stock toward Rs. 855 in the near term.
Medium-Term Strategy: Accumulating the stock around Rs. 780–790, backed by Fibonacci and moving average support, could yield a favorable risk-reward profile.
With a reasonable valuation (P/E at 8.86), solid institutional support, and India’s continued credit growth trajectory, SBI remains a top pick for diversified equity portfolios.
Conclusion
State Bank of India (SBI) continues to be a beacon of strength in India’s public banking domain. Strong fundamentals, institutional backing, consistent dividend payouts, and compelling technical indicators all point toward a bullish undertone. While investors should monitor short-term market volatility, SBI’s long-term trajectory appears well-aligned with India’s economic and financial sector expansion. The next resistance at Rs. 855.55, if broken, could unlock fresh momentum, offering lucrative upside for well-timed entries.
