Bharti Airtel Share Price Positive while Bajaj Finance Drops after Strategic Partnership, Bharti Bullish on Charts

Bharti Airtel share price was trading marginally higher but the stock is currently looking bullish on technical charts. Bajaj Finance shares were trading nearly one percent lower during the afternoon session. Bajaj Finance is currently trading very close to its 52-week highs. The stock has witnessed strong buying in the recent weeks.
Strategic Partnership between Airtel and Bajaj Finance
The partnership between Bharti Airtel and Bajaj Finance marks a significant step in India’s digital transformation. Announced on January 20, this alliance aims to establish one of the largest digital financial platforms in the country. Airtel will initially feature Bajaj Finance’s products on its Airtel Thanks App and later expand accessibility through its extensive retail network.
This collaboration will enhance financial penetration by combining Airtel's massive distribution network and Bajaj Finance's diverse suite of 27 financial products. Together, the two firms will strive to bridge the gap between digital technology and financial services for millions of Indians.
Integration of Digital Assets for Financial Inclusion
Combining Strengths: Airtel’s 370 million customer base and 1.2 million retail outlets, coupled with Bajaj Finance’s 5,000 branches and 70,000 field agents, create an unparalleled distribution network. The partnership leverages these assets to offer financial services to a broader audience, including underserved regions.
Focus on Security and Compliance:
Both companies have pledged to maintain stringent data privacy measures and adhere to regulatory standards. This ensures customer trust and the reliability of the services offered.
Leadership Vision for Digital Finance
Airtel’s Vice Chairman and MD, Gopal Vittal, highlighted the partnership as a cornerstone for building Airtel Finance into a strategic asset. “Our vision is to make Airtel Finance a one-stop shop for all the financial needs of our customers,” Vittal said, emphasizing the company’s commitment to scaling its financial services.
Rajeev Jain, MD of Bajaj Finance, echoed these sentiments, stating, “India’s digital infrastructure allows us to drive inclusive growth. Together with Airtel, we aim to become the financier of choice for millions, enabling access to financial services even in remote areas.”
Products and Services to Empower Customers
Piloted Offerings: Two Bajaj Finance products—Gold Loans and Business Loans—are already available on the Airtel Thanks App. By March, this will expand to include four products, adding co-branded Insta EMI Cards and Personal Loans to the portfolio.
Implications for India’s Digital Ecosystem
This partnership underscores the growing importance of data-driven credit underwriting and financial inclusion in India’s digital economy. By leveraging the strengths of two trusted brands, Airtel and Bajaj Finance aim to empower customers with seamless access to credit and financial products, fostering economic growth across urban and rural landscapes.
Bajaj Finance Technical Analysis
Candlestick Analysis
The daily candlestick pattern appears Bearish, suggesting selling pressure during the trading session. This could indicate potential weakness, but further validation is required using support and resistance levels.
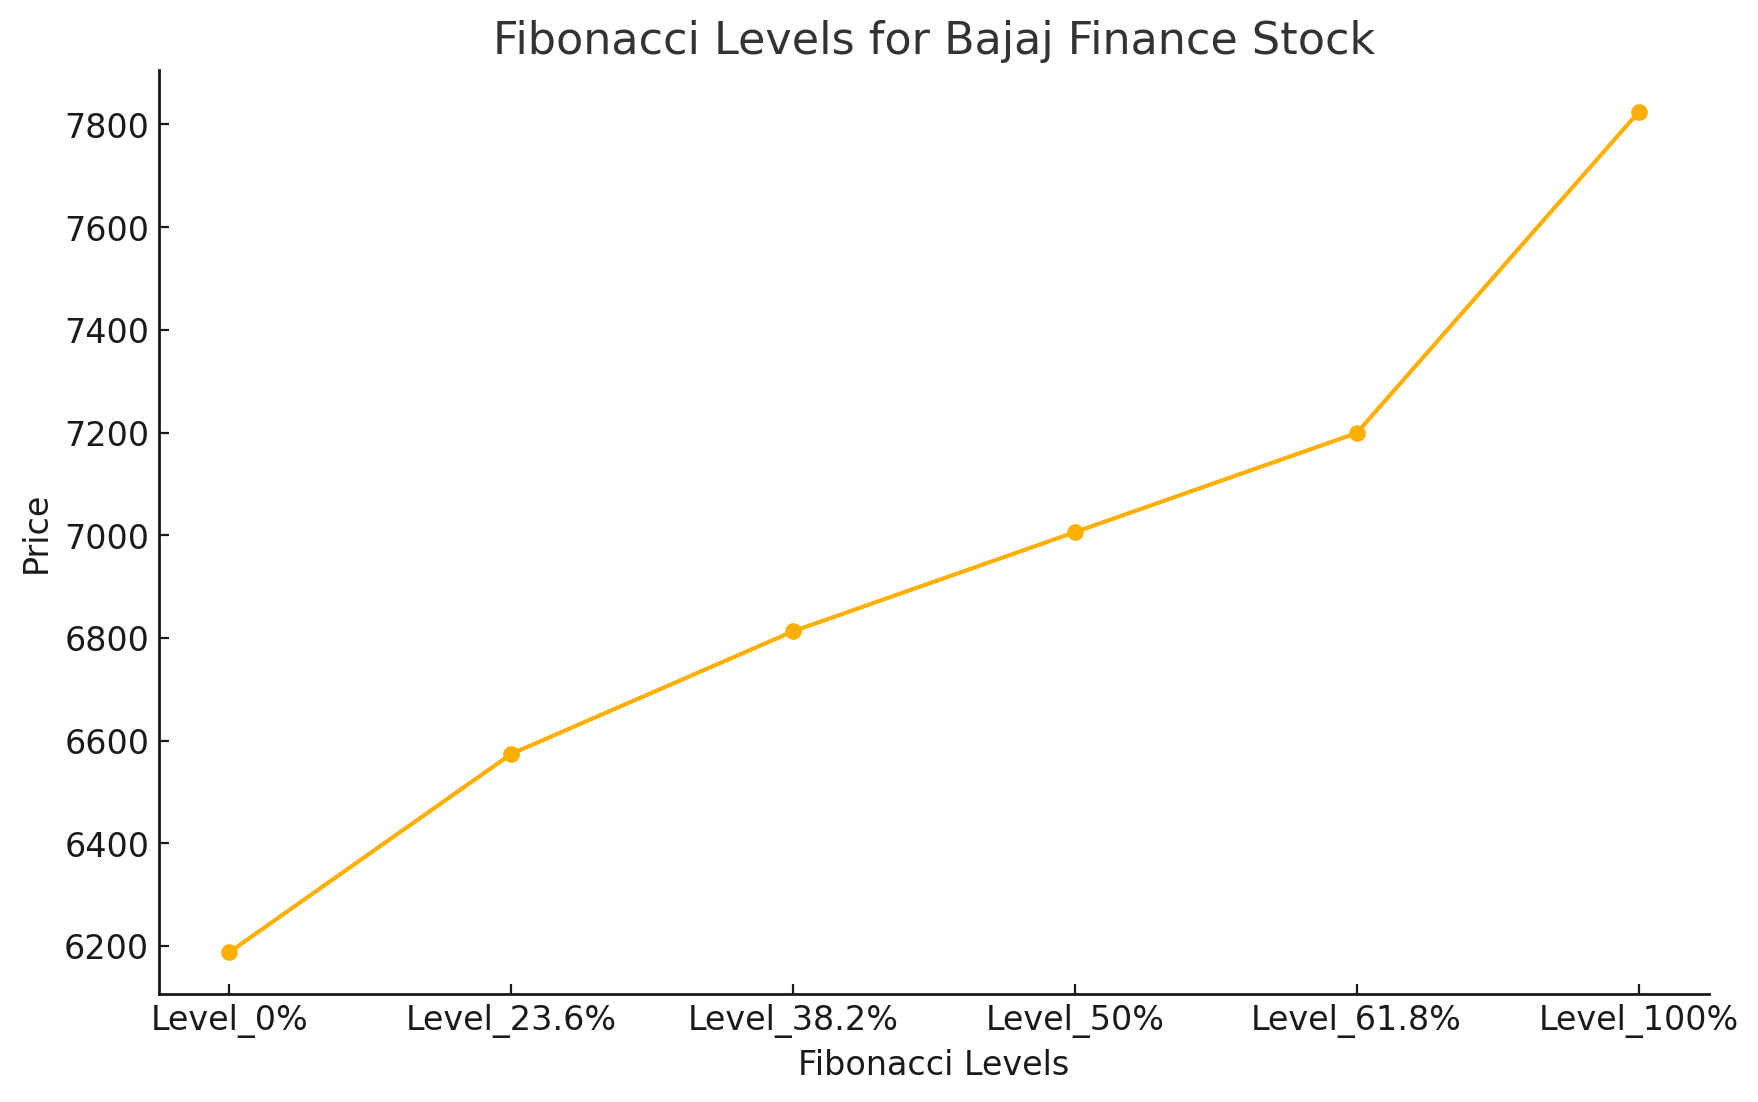
Strategy
Bullish Scenario:
If the stock price breaks above Rs. 7,485 (current resistance), it could indicate continued upward momentum. In this case, aim for higher Fibonacci levels as potential targets.
Bearish Scenario:
If the stock price falls below Rs. 7,330.55 (current support), consider targeting lower Fibonacci levels or even the 52-week low for possible buying opportunities.
Bharti Airtel Technical Analysis
Candlestick Analysis
The daily candlestick pattern appears Bearish, indicating selling pressure during the session. This may signal a potential downturn unless supported by bullish momentum.
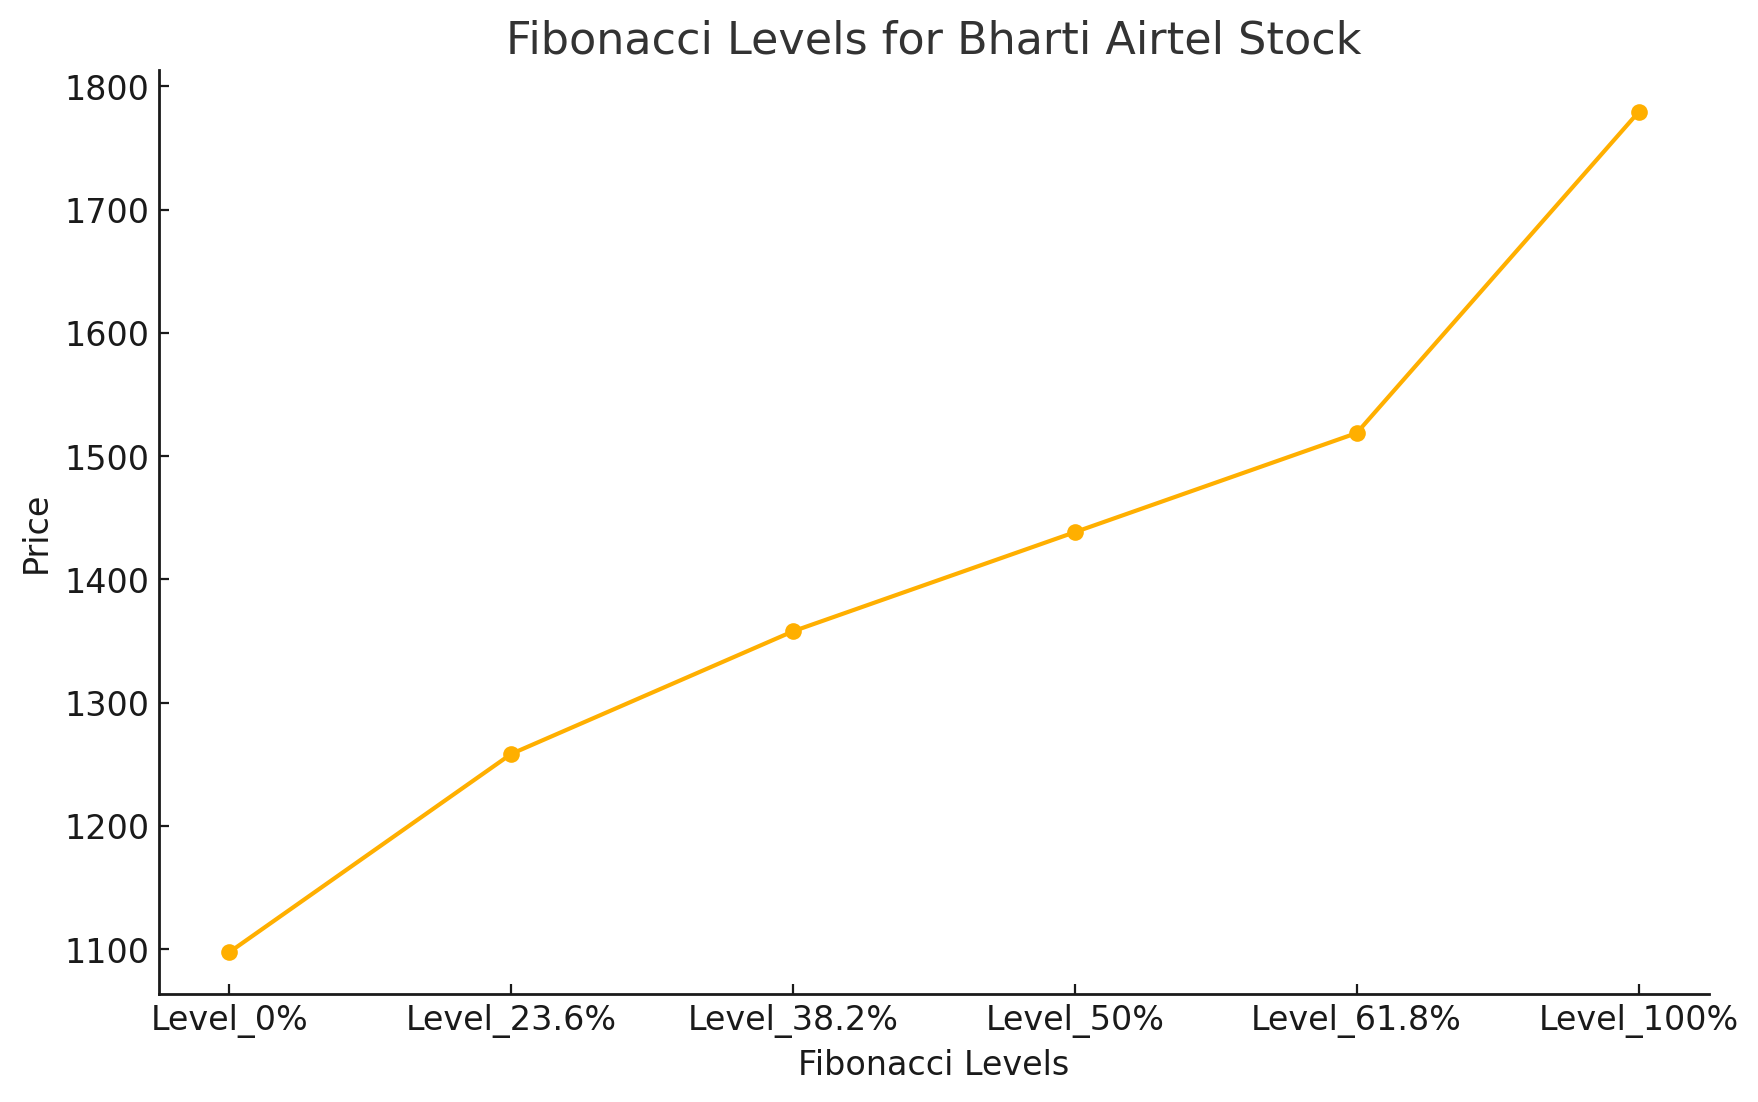
Fibonacci Analysis
Fibonacci retracement levels:
0%: Rs. 1,097.65
23.6%: Rs. 1,258.45
38.2%: Rs. 1,357.93
50%: Rs. 1,438.33
61.8%: Rs. 1,518.72
100%: Rs. 1,779.00
Price action near these levels will provide critical support and resistance zones, aiding trading decisions.
Support and Resistance Analysis
Support: Rs. 1,620.30
Resistance: Rs. 1,656.70
A breakout above Rs. 1,656.70 may suggest bullish momentum targeting higher Fibonacci levels. Conversely, a breach below Rs. 1,620.30 could indicate bearish sentiment, with lower Fibonacci levels or the 52-week low coming into focus.
Strategy
Bullish Scenario: Monitor for a breakout above Rs. 1,656.70 to confirm upward momentum and target higher Fibonacci retracement levels.
Bearish Scenario: A decline below Rs. 1,620.30 may present opportunities to short-sell or wait for a rebound near lower Fibonacci levels.
