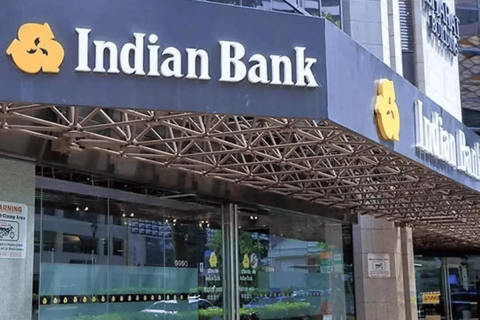
Indian Bank Share Price Jumps 1.8 Percent; Stock in Bullish Trend on Technical Charts
Indian Bank share price was trading firm on Monday at Rs 583 at the time of publication of this report. The public sector bank was trading 1.8 percent higher and touched intraday high at Rs 590. The stock is close to its 52-week highs and on daily technical charts has given a bullish breakout.
Indian Bank has emerged as a robust player in the Indian banking sector, offering investors both stability and growth potential. With a market capitalization of Rs 785.68 billion, the stock has shown resilience and is trading near its 52-week high of Rs 632.70. Backed by strong fundamentals, an attractive P/E ratio of 7.84, and a dividend yield of 2.06%, Indian Bank is well-positioned to deliver value. In this article, we dive into the bank’s financial performance, technical analysis, and competitive landscape to provide a comprehensive view for investors.
Financial Performance and Key Metrics
Consistent Growth: Indian Bank has demonstrated strong financial performance, bolstered by its operational efficiencies and improved asset quality. The stock opened at Rs 572.85, reached a high of Rs 590.20, and hit a low of Rs 572.70, reflecting healthy trading volumes and investor confidence.
Key Financial Highlights:
Market Cap: Rs 785.68 billion
P/E Ratio: 7.84
Dividend Yield: 2.06%
52-Week Range: Rs 391.00 – Rs 632.70
The attractive P/E ratio indicates the stock is relatively undervalued compared to peers, making it an enticing choice for value investors.
Recent Developments and Strategic Moves
Strengthened Loan Book: Indian Bank has expanded its credit portfolio, focusing on retail and small and medium enterprises (SMEs), driving loan growth and diversifying risk. Its asset quality has also improved, with non-performing assets (NPAs) showing a consistent decline.
Digital Transformation: The bank’s investment in digital banking services has enhanced customer engagement and operational efficiency, positioning it as a leader in digital innovation.
Technical Analysis
Candlestick Patterns: A bullish candlestick pattern was observed on the daily chart, indicating potential upward momentum. The stock’s recent breakout above Rs 580 confirms a strong buying zone.
Fibonacci Retracement Levels: Based on the 52-week high and low, the Fibonacci retracement levels for Indian Bank are as follows:
| Fibonacci Level | Price (Rs) |
|---|---|
| 0% (52-week low) | 391.00 |
| 23.6% | 453.48 |
| 38.2% | 490.33 |
| 50% | 511.85 |
| 61.8% | 533.37 |
| 76.4% | 570.22 |
| 100% (52-week high) | 632.70 |
Support and Resistance Levels:
Support Levels: Rs 560 and Rs 540
Resistance Levels: Rs 600 and Rs 632
Investors can consider accumulating the stock near support levels with a stop-loss at Rs 540 and target levels of Rs 600 and Rs 632.
Market Sentiment and Analyst Recommendations
Investor Sentiment: Indian Bank has garnered positive sentiment due to its improving fundamentals and growth prospects. Analysts have lauded its focus on reducing NPAs and enhancing operational efficiencies.
Analyst Recommendations: Analysts have pegged a target price range of Rs 650–Rs 680, citing strong growth in profitability and loan disbursements.
Conclusion
Indian Bank’s strong financials, focus on digital transformation, and attractive valuation make it a compelling pick for long-term investors. While near-term volatility may persist, the stock’s potential for consistent growth and robust dividend yield make it a promising addition to a diversified portfolio.
